
It’s Love Data Week! This year’s theme is “My Kind of Data,” and we have a guest post from Laura Hjerpe, Senior Research Data Management Librarian.

In recognition of Love Data Week 2024, I’m featuring Charlottesville data stories from the University of Virginia Equity Center and local data from the City of Charlottesville, the Commonwealth of Virginia, and the U.S. Government. I chose this because my kind of data is a data story with human interest, backed up by reliable data sources.
Data stories from the Equity Center
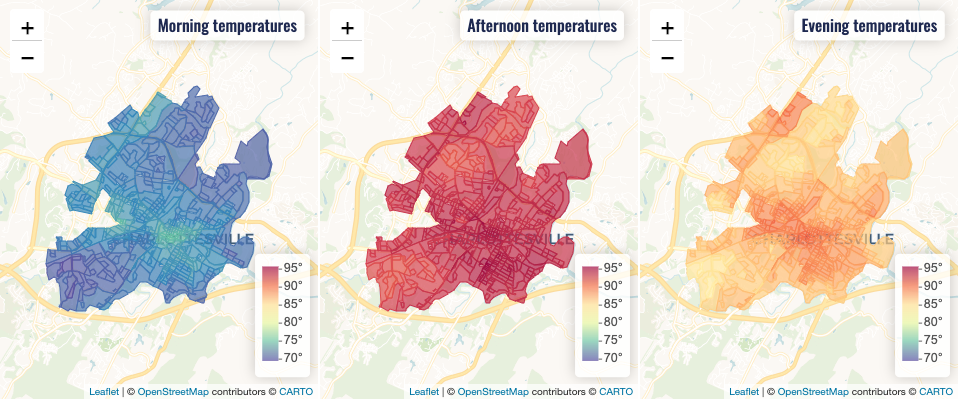
Health outcomes in the Charlottesville region, one of three Picturing Climate Justice data stories from the Equity Center, begins with a discussion about how environmental factors connected with climate change can affect physical and mental health, especially that of African Americans. Eight visualizations show the relationships between socioeconomic characteristics, such as income, racial demographics, age, and location with health outcomes such as asthma, diabetes, and poor physical health. Every visualization is accompanied by variable definitions, data sources, and Python code used to create the visualizations. Additionally, a new piece on Charlottesville Urban Heat Islands has been added that updates prior climate equity work. You may find this report and others on the Charlottesville Regional Equity Atlas by scrolling down and clicking “See all Reports.”
The Charlottesville Regional Climate Equity Atlas can be used to explore social, infrastructure, and climate measures. To use, select any two measures to see the relationship between the measures in census tracts across the greater Charlottesville region. Researchers may narrow visualizations to specific counties or to the city of Charlottesville and choose from eight categories of variables: Demographic and Social, Health, Youth and Education, Jobs and Income, Housing and Transportation, Risk Factors, Community Assets and Infrastructure, and Climate Measures. After selecting a measure, the system shows that measure’s definition and data source.
These resources not only amplify data about Charlottesville area residents, but they also walk the reader through the data to make it easier to understand.
Local data collections
Charlottesville has a number of local data collections. First, Charlottesville Open Data has municipality-generated data, such as Real Estate (Commercial Details) and a Tree Inventory. It features Charlottesville maps with city operations, historical preservation, and Green City data.
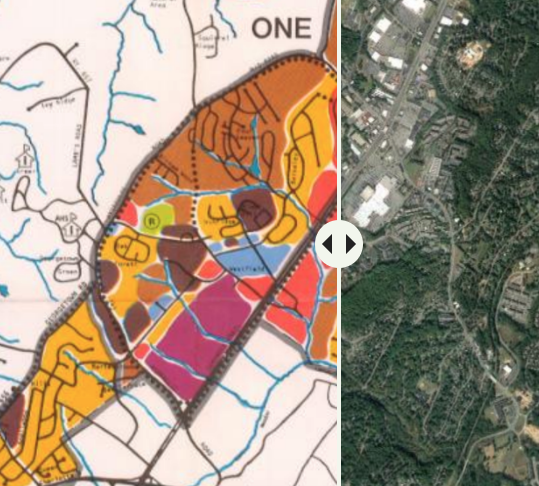
Equity and Open Data features local historical data, as well as stories such as Union Ridge Today, a story told with maps about the transition of a neighborhood from Black-owned farmland to a busy Charlottesville suburb. There is overlap of datasets with Charlottesville Open Data, since both sites focus on local data.
Virginia Open Data Portal contains Commonwealth-wide data. Popular topics include COVID-19, policing, food, and civil suit judgements. One popular historical dataset is called Freedom Suits which contains petitions initiated by enslaved people seeking to gain their freedom. Details extracted from these petitions include names, ages, years, claims, and judgements. The full text digital documents may be retrieved by file name from Virginia Untold: The African American Narrative. This collection, from the Library of Virginia, provides access to digital records documenting lived experiences of enslaved and free Black and multiracial people.
Local data from the U.S. government
The 2015-2019 American Community Survey (ACS) 5-Year Estimates found in Social Explorer are produced by the federal government and contain local data from communities throughout the United States, including the Charlottesville area. The 2015-2019 ACS 5-Year Estimates is a nationwide survey that asks about topics such as education, employment, internet access, transportation. The 5-year estimates represent data collected over 60 months and provide multiyear estimates for geographic areas with fewer than 65,000 residents. For more information about the ACS survey, see Understanding and Using American Community Survey Data: What All Data Users Need to Know.
CDC Places, a collaboration between the Centers for Disease Control and Prevention (CDC) and the Robert Wood Johnson Foundation, reports county, place, census tract, and Zip Code Tabulation Areas (ZCTA) data and uses small area estimation methods to obtain 36 chronic disease measures.
Ready to find your own data? Visit our Data and Statistics LibGuide for search strategy tips and to find data archives, data on a topic, and more.
Visualization training
 Do you want to get started with visualizing your own data? Check out our RDS workshops. If you can’t make a session, reach out to the instructor for a one-on-one consultation.
Do you want to enhance your story with maps? Visit Scholar’s Lab GIS Workshops. Coming up soon, Web Mapping and Visualization and Spatial Analysis with ArcGIS Online are offered during the last two weeks in February. Both workshops are one hour and assume no previous experience using GIS.
There are lots of ways we can help — visit our Research Data Services site to learn about what we can offer. If you need help with finding data or using visualization tools, analyzing the data you already have, or managing your data, reach out to researchdataservices@virginia.edu.
.